How to read 3D Volatility Surface
1. Volatility Curve
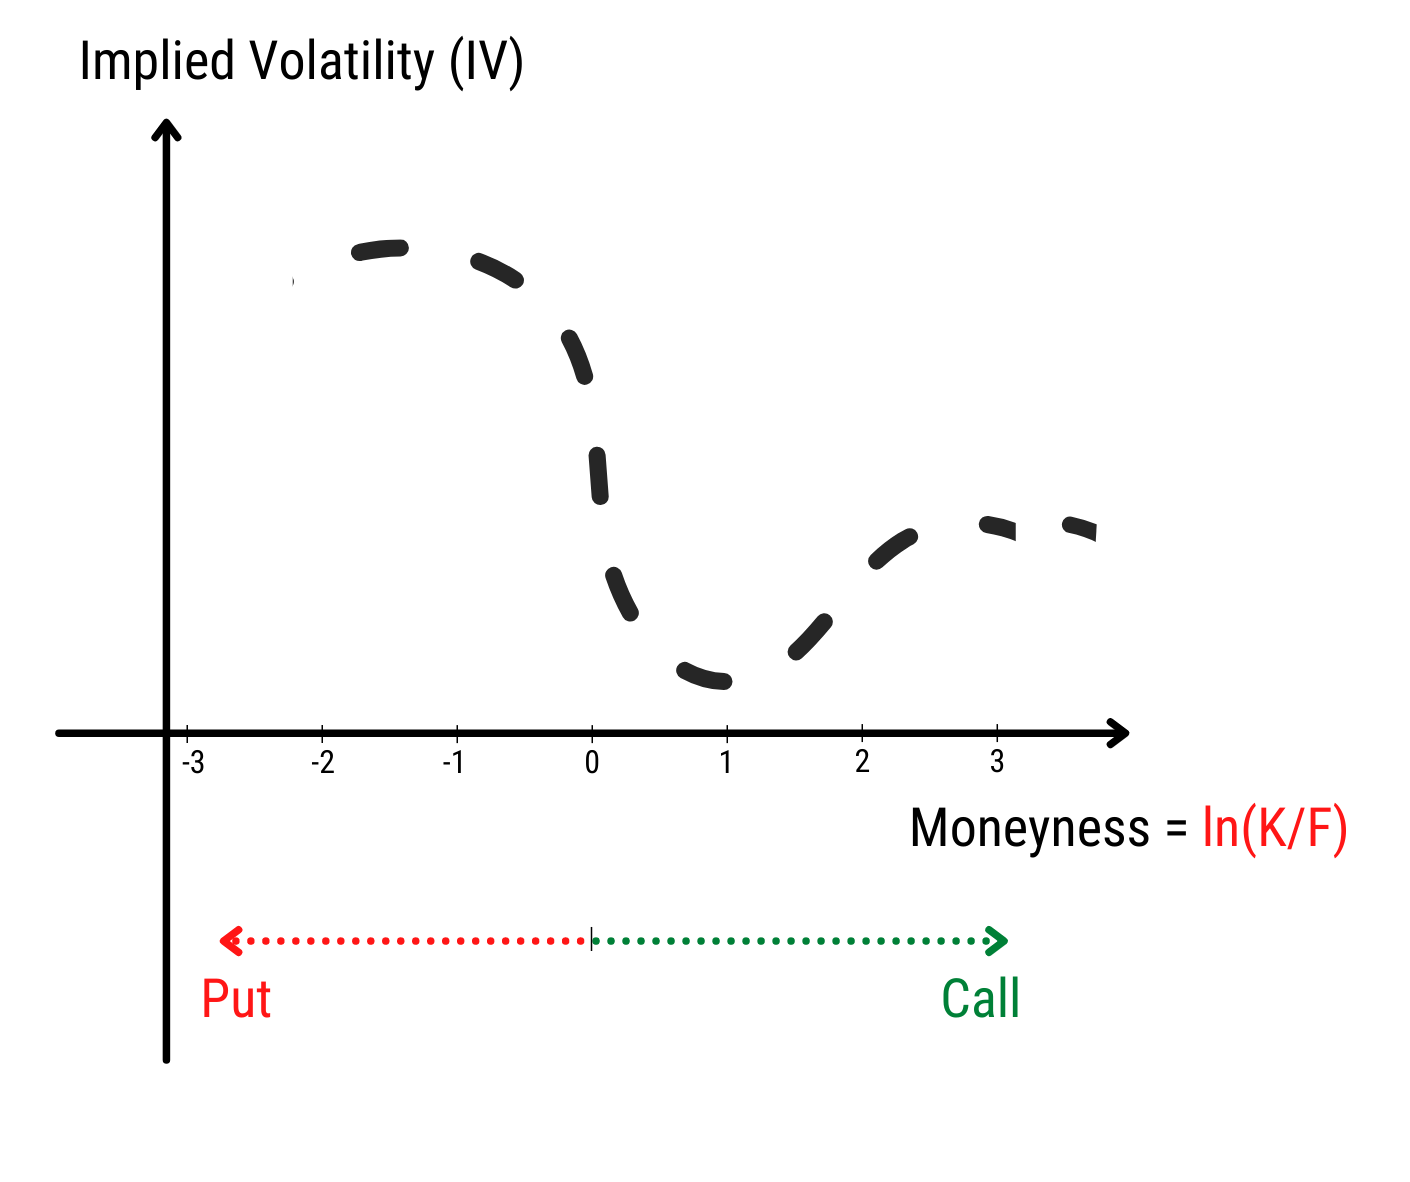
A volatility curve is a common graph shape that results from plotting the strike price (in form of moneyness) and implied volatility (IV) of a group of options with the same underlying and expiry
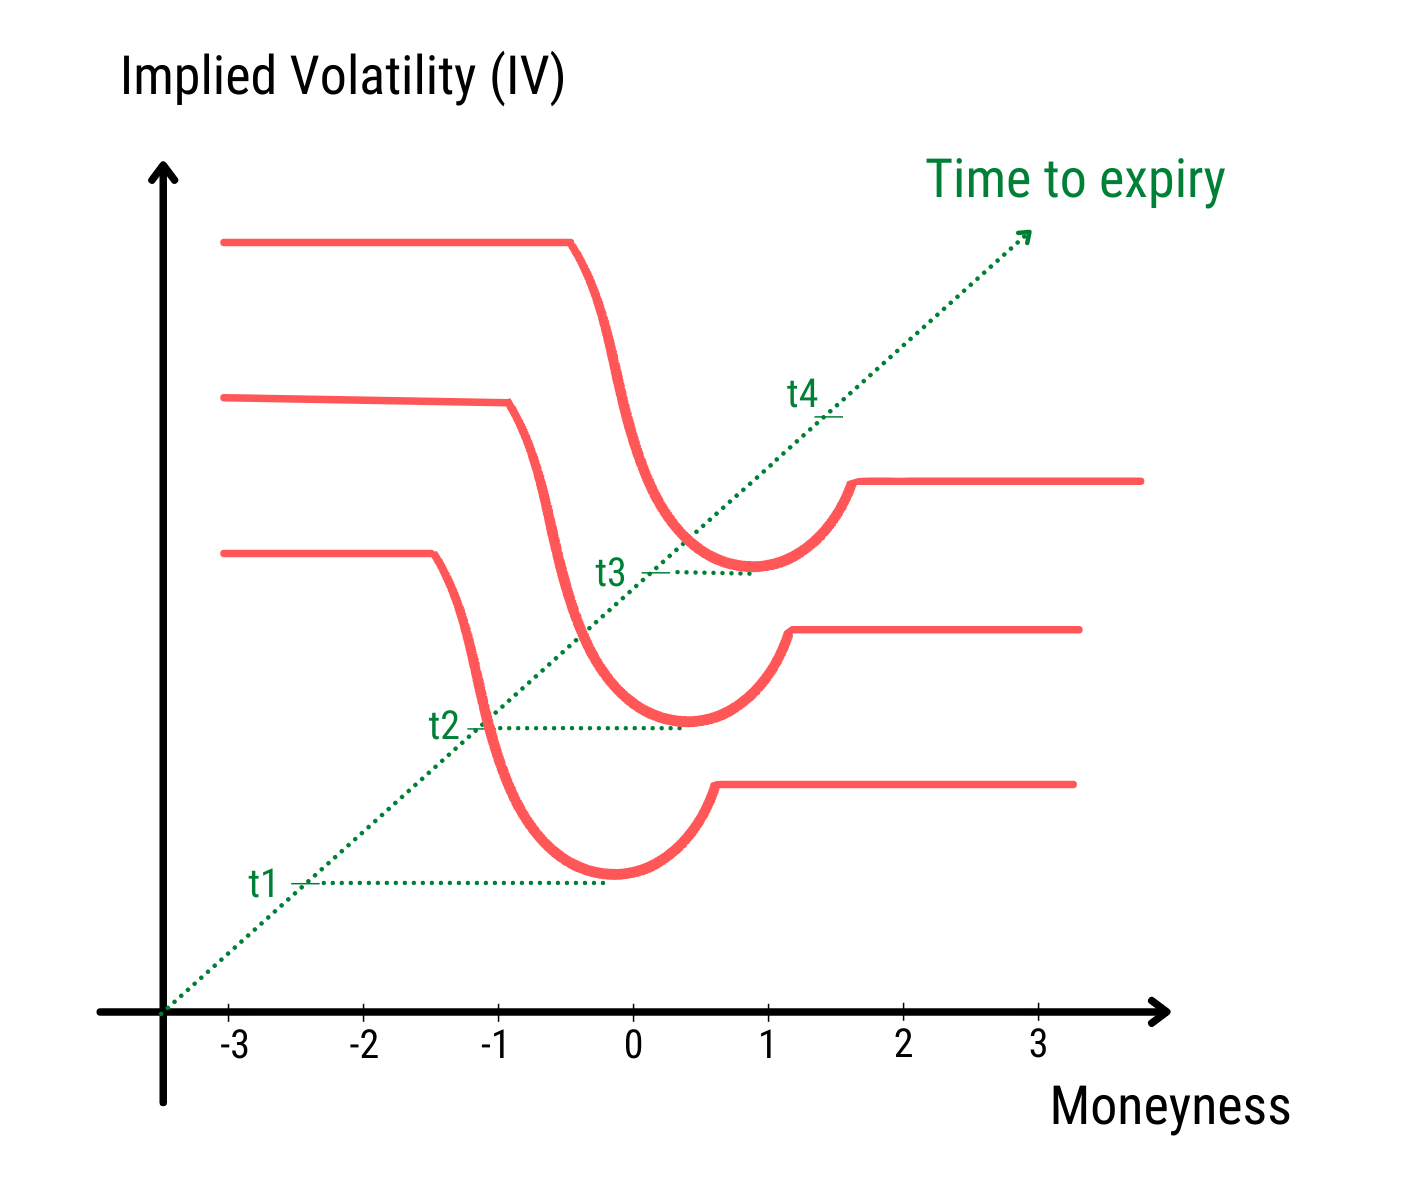
Therefore, there is always one volatility curve corresponding to one expiry.
The formula for moneyness is ln(K/F) where K is strike price, F is the future price (can take the underlying px directly).
From 0 moneyness to the left is usually meant for Put, from 0 moneyness to the right is usually meant for Call.
2. Volatility surface
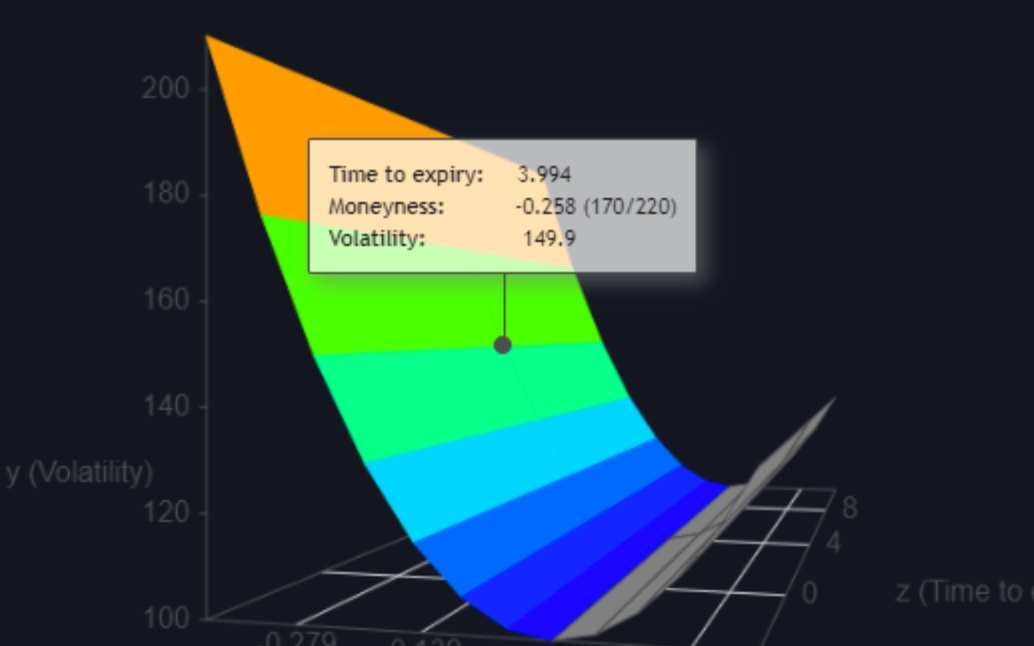
The volatility surface is a three-dimensional plot where the z-axis is the time to maturity, the x-axis is the moneyness, and the y-axis is the implied volatility.
Essentially, a 3d volatility surface is made up a group of volatility curves
3. How to make use of DBOE 3D volatility surface
Find out what’s indicative IV for a particular Option (Call/Put CP, strike price K and expiry exp)
Find out the corresponding volatility curve from the expiry: exp
Workout moneyness = ln(K/F), for example moneyness = -0.258
Narrow down the left or the right part of the curve depending on the Option being a Call or a Put.
Identify the point having the moneyness of -0.258, hover the cursor around this point. IV will be displayed together with other info
Find out Skewness: TBC (to-be-confirmed)
Last updated